
Big Data and statistics
A statistician's perspective

Big Data brings unprecedented power to address scientific, economic and societal issues, but also amplifies the possibility of certain pitfalls. These include using purely data-driven approaches that disregard understanding the phenomenon under study, aiming at a dynamically moving target, ignoring critical data collection issues, summarizing or preprocessing the data inadequately and mistaking noise for signal. We review some success stories and illustrate how statistical principles can help obtain more reliable information from data. We also touch upon current challenges that require active methodological research such as strategies for efficient computation, integration of heterogeneous data, extending the underlying theory to increasingly complex questions and, perhaps most importantly, training a new generation of scientists who can develop and deploy these strategies.
Keywords: Big Data, statistics, case studies, pitfalls, challenges.
What is Big Data?
Recent years have seen a marked increase in our capacity to collect, store and share data. According to IBM, 90 % of the data in the world was generated in the last two years (International Business Machines Corporation, 2011). These data arise from the Internet (searches, social networks, blogs, pictures), smartphones, scientific studies (genomics, brain imaging, epidemiology, environmental research), businesses (customer records, transactions, financial indicators), governments (population, healthcare, weather, automatic sensors) and other sources.
The strategic importance of Big Data lies not on the quantity but on the potential uses. For instance, the characterization of complex diseases at the molecular level combined with medical and treatment history, diagnostic or imaging tests offers unprecedented opportunities for personalized medicine. The Large Hadron Collider records data 40 million times per second to test theories in physics. Websites make millions of recommendations every day, study new products and their prices. Data can help manage cities or natural resources, study climate change or aid developing regions. Postings in blogs and social networks are used to devise political strategies and study how ideas spread.
«Experience has taught statisticians that data can be misleading and, even worse, wrongly give the semblance of objectivity»
Due to this far-reaching potential, Big Data has been embraced by media, academia and businesses in an enthusiastic, sometimes even sensationalist, manner. Terms such as data deluge or tsunami are common. The 2012 World Economic Forum declared data as a new class of economic asset like currency or gold (World Economic Forum, 2012). Data-related professions consistently top most rankings. I step back from the hype and review both success stories and limitations, pointing out perceived lessons and pending challenges. While Big Data requires a multidisciplinary approach, I adopt a statistical viewpoint. Statistics is the field wholly devoted to collecting, analyzing and interpreting data. That is, to bringing us from questions to data, from data to information, and from information to knowledge and decisions. It might seem surprising then that statisticians have been relatively cautious in embracing Big Data as an almighty power. I believe that the explanation is simple. Experience has taught statisticians that data can be misleading and, even worse, wrongly give the semblance of objectivity. Along with power, Big Data also brings the opportunity for ample misconceptions. Because of the variety in applications (Big Data is often defined with 3V’s: Volume, Velocity and Variety) a comprehensive review is hopeless, hence I limit discussion to some of the main issues and examples.
Data and the underlying process

The account of how baseball manager Billy Beane used performance metrics and data analysis to assemble a competitive team became an instant classic of successful data stories, and even resulted in a major Hollywood film. / Leaders (Executive Sport Ltd)
The account of how baseball manager Billy Beane used performance metrics and data analysis to assemble a competitive team (Lewis, 2003) became an instant classic of successful data stories, and even resulted in a major Hollywood film. The notable feat is that his team performed better than higher-budget competitors assembled by baseball experts. The extremely accurate forecasts of UK (Curtice and Firth, 2008) and USA (Silver, 2012) elections, amply beating political analysts, were other immediate hits. Other cases include weather predictions forecasting major catastrophes (Silver, 2012), or the explosion in -omics technologies underlying many, if not most, recent advances in biomedicine.
These stories may have given the wrong impression that data can reign alone. For instance, The New York Times interviewees claimed that data can replace experience and intuition, and that this leads to a more scientific approach (Lohr, 2012). I could not be in stronger disagreement with this view, which illustrates a potential pitfall with Big Data. While it is true that untested opinions may lead to wrong conclusions, blind analyses do just as often. The value of data and substantive expertise exist not in opposition but in complement of each other. In the examples above, predictions were successful because they studied fundamentally reproducible systems, and they incorporated an understanding of the phenomenon under study. The variables chosen to predict baseball performance had a natural subject-of-matter interpretation. Silver’s predictions incorporated his knowledge of US politics. Weather forecasts are based on computer simulations and physical laws, which meteorologists subsequently correct for systematic inaccuracies. New technologies are useless unless brilliant scientists pose relevant questions and interpret the results in context.
«New technologies are useless unless brilliant scientists pose relevant questions and interpret the results in context»
A statistical mantra states that correlation does not imply causation. Nathan Eagle pioneered work to predict cholera in Rwanda from cell phone mobility data (Shaw, 2014). He observed that mobility correlated with cholera outbreaks and could hence help predict them. He later found that mobility really predicted floods, which reduce mobility and increase short-term risk of cholera outbreaks. He now incorporates insight on the activities going on in the villages when making predictions. There is no substitute to having an understanding of the phenomenon under study, i.e. the data-generating process, and bringing it into the analysis.
Dynamics in the data
The USA Centers for Disease Control and Prevention (CDC) report weekly numbers of doctor visits for influenza-like illnesses, but due to data handling the reports lag 3 weeks behind. Google Flu Trends (GFT) uses the number of flu-related Internet searches to predict the eventual CDC report for the current week, providing real-time monitoring that was at one time claimed to be more accurate than CDC reports. Although GFT was not intended this way, it became a flagship of Big Data replacing traditional methods. However, Lazer et al. (2014) amongst others reported that GFT predictions have not been that good. Although they were precise in their early days, the actual visits were systematically over-estimated ever after. Simply predicting this week from the CDC report three weeks ago gave better predictions. Lazer et al. argue that the decrease in GFT accuracy is mostly due to changes in Google’s search engine. This example illustrates another important pitfall. In the baseball and other examples above, the underlying process generating the data stays mostly constant through time. Baseball rules are fixed, political poll biases do not change much on the short term, and the laws of nature are constant. In contrast, changes in the search engine alter the process generating GFT’s input data, in turn modifying its relationship with the outcome we intend to predict.
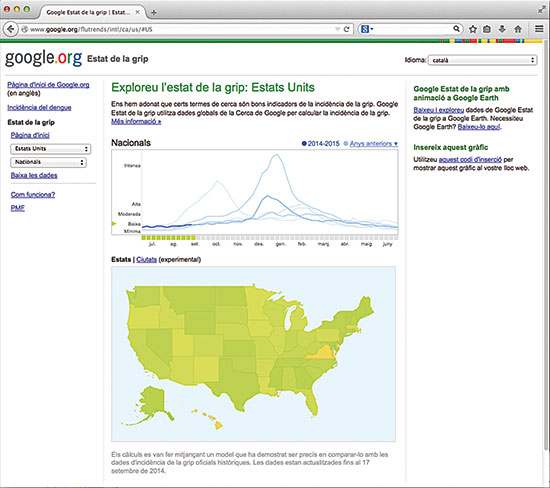
The USA Centers for Disease Control and Prevention (CDC) report weekly numbers of doctor visits for influenza-like illnesses, but due to data handling the reports lag 3 weeks behind. Google Flu Trends (GFT) uses the number of flu-related Internet searches to predict the eventual CDC report for the current week, providing real-time monitoring that was at one time claimed to be more accurate than CDC reports. / Mètode
This is known as a dynamic system in the statistical literature and requires special techniques to incorporate its peculiar structure and realistically reflect uncertainty. Predictions are based on observed data, hence an implicit assumption is that future data will be similar or at least evolve in a predictable fashion. When abrupt changes are possible, the confidence in our predictions diminishes. Consider the failure to anticipate mortgage defaults in the Big Recession. The risk of default was estimated from data collected during a mostly expanding economy. In such periods the risk that individuals A and B default on their mortgages are not particularly correlated. Therefore the risk of widespread defaults was deemed low; even if some individuals failed to pay surely others would continue to be solvent. However, in periods of crisis defaults are strongly dependent. If the economy is bad and house prices decrease, many individuals may default at once and the chances for a general crisis are much higher (Gorton, 2009). This example illustrates a pitfall known as extrapolation. Even when we have some understanding of the data-generating process, making predictions in situations for which little or no data are available is dangerous. Most methods are calibrated to produce predictions that are good overall, but even when most predictions are accurate those under uncommon settings (e.g. patients with a rare variant of a disease) may fail completely. A careful consideration of the problem at hand cannot be eluded.
Signal, noise and biases
Theory tells us that, in principle, having more data is always good. With new data comes the potential for more information and, if this were not the case, one could always discard that data. No harm could possibly come from having more data. The flaw in this reasoning is that in practice we do not discard data but try to look for patterns therein. A tempting pitfall is to torture the data until it appears to support some pre-conceived idea. This is not to say that data analysis should not be driven by pre-specified hypotheses, but that an adequate strategy is required to reduce the chances of non-reproducible findings. The last two decades have seen exciting advances in statistical methods to disentangle signal from noise in massive data. But these advances have not yet reached routine analyses. Nuzzo (2014) estimated that, when observing a p-value of 0.01 for a hypothesis with 19-to-1 odds of not being true, the probability of it being a false positive is 0.89. With Big Data we often record data because we are able to, not necessarily expecting a substantial amount of signal. The odds are then much higher than 19-to-1 and the chances for false positives skyrocket.

Big Data often comes from different locations, techniques or formats. These are not necessarily comparable or have the same quality and are often subject to various systematic biases. This kind of problems was faced by the ENCODE project, one of the largest initiatives following the Human Genome Project. The data were collected in labs all over the world, using multiple technologies and experimental procedures. In the picture, the ENCODE team of HudsonAlpha Institute (Huntsville, USA). / ENCODE Project
Another critical issue is that Big Data often comes from different locations, techniques or formats. These are not necessarily comparable or have the same quality and are often subject to various systematic biases. For instance, the ENCODE project is one of the largest initiatives following the Human Genome Project. The data were collected in labs all over the world, using multiple technologies and experimental procedures. When developing a system to visualize these massive data, we found systematic biases between microarray and sequencing technologies that needed to be corrected to avoid misleading interpretations (Font-Burgada et al., 2013). More generally, visualizing heterogeneous data for easy assimilation poses challenges, but progress is being made. For instance, blood flow visualizations devised by Michelle Borkin and her supervisors increased the ability of physicians to diagnose arterial blockages from 39 to 91 percent (Shaw, 2014). In the past, meta-analysis methods were devised to combine evidence from multiple studies in a principled manner. Big Data calls for new methods for reliable data integration and visualization.
Planning in advance
Big Data is changing how we collect evidence. Rather than carefully designing a study, there is some tendency to record as much data as possible, implicitly assuming that any patterns observed therein must surely be reliable. This misconception is a highly problematic pitfall. The representativeness of the data does not depend on the sample size but on the manner in which it is collected. Quality matters more than quantity. A classical example is a UK study with 20,000 children assessing the benefits of Pasteurized milk. William Gosset, better known as Student, pointed out that due to inadequate randomization a study with only 6 twin pairs would have been more reliable (Student, 1931). A factor contributing to lack of attention to study design may be an excessive faith in new technologies. For instance, the scientific community received the advent of high-throughput sequencing (HTS) enthusiastically. I interacted with reputed researchers who argued that HTS studies with a single sample were as good as dozens of samples with earlier technologies. While HTS is accurate, clearly a single sample cannot measure variability to compare populations. Another anecdote is HTS centers processing two samples at different dates when they should have been processed in parallel to avoid biases. As a result, expensive experiments were rendered virtually useless.
The extension of the experimental design theory pioneered by Ronald Fisher to Big Data has been mostly neglected, but there are notable exceptions. As we transition to personalized medicine, Berry (2012) argued for clinical trials that adapt to ever-smaller patient subgroups and take individual decisions for each patient. Müller et al. (2004) proposed principled designs for massive hypothesis testing studies. Successful designs for observational studies have also been proposed. To show the advantages of public health insurance in Mexico, King et al. (2009) designed a study to compare insured and uninsured communities. Because these had similar characteristics, differences in health outcomes could be attributed to the insurance rather than external factors.

Netflix movie recommendations use model averaging on 107 predictions. Decision theory can help assess the benefits of complex algorithms in the face of uncertainty and competing goals, e.g. customer satisfaction may also depend on recommendation diversity. / Mètode
A case for statistics
Much in the way that pioneers such as Ronald Fisher, William Gosset or Harold Jeffreys set the basis for data-based science, business and public policy, the Big Data paradigm is fueled by methodological contributions. The Pagerank algorithm used by Google’s engine is based on Markov Chains. Netflix movie recommendations use model averaging on 107 predictions. Decision theory can help assess the benefits of complex algorithms in the face of uncertainty and competing goals, e.g. customer satisfaction may also depend on recommendation diversity.
«Statistics is a necessary component for the Big Data revolution to reach full potential. However, statistics cannot exist in isolation»
We already discussed the need to research new methods to disentangle signal from noise, capture dynamic processes, design experiments and integrate heterogeneous data. Computational methods that combine processing power with clever strategies to solve complex problems are another central issue, as brute-force approaches are unlikely to succeed. Further challenges include data retrieval and summarization. Automatic methods to scan and format unstructured data (e.g. pictures, blogs) may discard information or induce biases. Also, our currently generating more data than we can store (Hilbert, 2012) imposes the need to summarize data. Summaries imply a potential for loss of information. As an example we recently reported that the current strategy to summarize RNA-sequencing data discards so much information that one cannot learn certain features even as the amount of data grows to infinity (Rossell et al., 2014). A related issue is that of sampling. Storing an adequate sample obtained from all data can benefit speed and cost for a negligible loss in precision. See Fan et al. (2014) and Jordan (2013) for reviews on statistical and computation issues for Big Data.
As a unique combination of scientific reasoning, probability theory and mathematics, statistics is a necessary component for the Big Data revolution to reach full potential. However, statistics cannot exist in isolation but in collaboration with subject-of-matter expertise, computer science and related disciplines. As a final thought, the main obstacle to overcome may well be the lack of professionals with an adequate combination of skills. Recruitment and training of young minds willing to engage this exciting venture should be a top priority.
Acknowledgements:
Work partially supported by NIH grant R01 CA158113-01.
References
Berry, D., 2012. «Adaptive Clinical Trials in Oncology». Nature Reviews Clinical Oncology, 9: 199-207. DOI: <10.1038/nrclinonc.2011.165>.
Curtice, J. and D. Firth, 2008. «Exit Polling in a Cold Climate: the BBC-ITV Experience Explained». Journal of the Royal Statistical Society A, 171(3): 509-539. DOI: <10.1111/j.1467-985X.2007.00536.x>.
Fan, J.; Han, F. and H. Liu, 2014. «Challenges of Big Data Analysis». National Science Review, 1(2): 293-314. DOI: <10.1093/nsr/nwt032>.
Font-Burgada, J.; Reina, O.; Rossell, D. and F. Azorín, 2013. «ChroGPS, a Global Chromatin Positioning System for the Functional Analysis and Visualization of the Epigenome». Nucleic Acids Research, 42(4):1-12. DOI: <10.1093/nar/gkt1186>.
Gorton, G., 2009. «Information, Liquidity, and the (Ongoing) Panic of 2007». American Economic Review, 99(2): 567-572. DOI: <10.1257/aer.99.2.567>.
Hilbert, M., 2012. «How Much Information Is There in the "Information Society"?». Significance, 9(4): 8-12. DOI: <10.1111/j.1740-9713.2012.00584.x>.
International Business Machines Corporation, 2011. IBM Big Data Success Stories. International Business Machines Corporation. Armonk, NY. Available at: <http://public.dhe.ibm.com/software/data/sw-library/big-data/ibm-big-data-success.pdf>.
Jordan, M., 2013. «On Statistics, Computation and Scalability». Bernoulli, 19(4): 1378-1390. DOI: <10.3150/12-BEJSP17>.
King, G. et al., 2009. «Public Policy for the Poor? A Randomized Assessment of the Mexican Universal Health Insurance Programme». The Lancet, 373: 1447-1454. DOI: <10.1016/S0140-6736(09)60239-7>.
Lazer, D.; Kennedy, R.; King, G. and A. Vespignani, 2014. «The Parable of Google Flu: Traps in Big Data Analysis». Science, 343(6176): 1203-1205. DOI: <10.1126/science.1248506>.
Lewis, M., 2003. Moneyball. The Art of Winning an Unfair Game. W. W. Norton & Company. New York.
Lohr, S., 2012. «The age of Big Data». The New York Times, 11 de febrer de 2012. Available at: <www.nytimes.com/2012/02/12/sunday-review/big-datas-impact-in-the-world.html>.
Müller, P.; Parmigiani, G.; Robert, C. and J. Rousseau, 2004. «Optimal Sample Size for Multiple Testing: The Case of Gene Expression Microarrays». Journal of the American Statistical Association, 99(468): 990-1001. DOI:<10.1198/016214504000001646>.
Nuzzo, R., 2014. «Scientific Method: Statistical Errors». Nature, 506: 150-152. DOI:<10.1038/506150a>.
Rossell, D.; Stephan-Otto Attolini, C.; Kroiss, M. and A. Stöcker, 2014. «Quantifying Alternative Splicing from RNA-Sequencing Data». The Annals of Applied Statistics, 8(1): 309-330. DOI: <10.1214/13-AOAS687>.
Shaw, J., 2014. «Why "Big Data" Is a Big Deal». Harvard Magazine, 3:30-35, 74-75. Available at: <http://harvardmag.com/pdf/2014/03-pdfs/0314-30.pdf>.
Silver, N., 2012. The Signal and the Noise: Why So Many Predictions Fail – but Some Don't. Penguin Press. New York.
Student, 1931. «The Lanarkshire Milk Experiment». Biometrika, 23(3-4): 398-406. DOI: <10.2307/2332424>.
World Economic Forum, 2012. Big Data, Big Impact: New Possibilities for International Development. Fòrum Econòmic Mundial. Cologny, Suïssa. Available at: <www3.weforum.org/docs/WEF_TC_MFS_BigDataBigImpact_Briefing_2012.pdf>.